
It's often helpful to debug a web page hosted in a webview in order to inspect its layout or troubleshoot JavaScript. Fortunately, it's easy to remotely inspect webviews that are running in your application.
Enabling remote debugging
Start by enabling the Remote Debugging option on your WebViewPrefab or CanvasWebViewPrefab (or call Web.EnableRemoteDebugging() instead if you prefer):

Next, follow the instructions for the 3D WebView plugin you're using:
- Windows and macOS (Chromium)
- iOS, visionOS, and macOS WebKit
- Android (System WebView)
- Android with Gecko Engine
- UWP / Hololens
- WebGL
Windows and macOS (Chromium)
For the default Chromium browser engine of 3D WebView for Windows and macOS, you can inspect web content with Chrome DevTools using the following steps:
First, enable remote debugging for your application as described in the section at the top of this article.
Install Chrome on your dev computer if you haven't already.
While your application is running with remote debugging enabled, open Chrome and load the URL
chrome://inspect, Chrome's built-in page for inspecting remote Chromium instances. This page lists the inspectable webviews.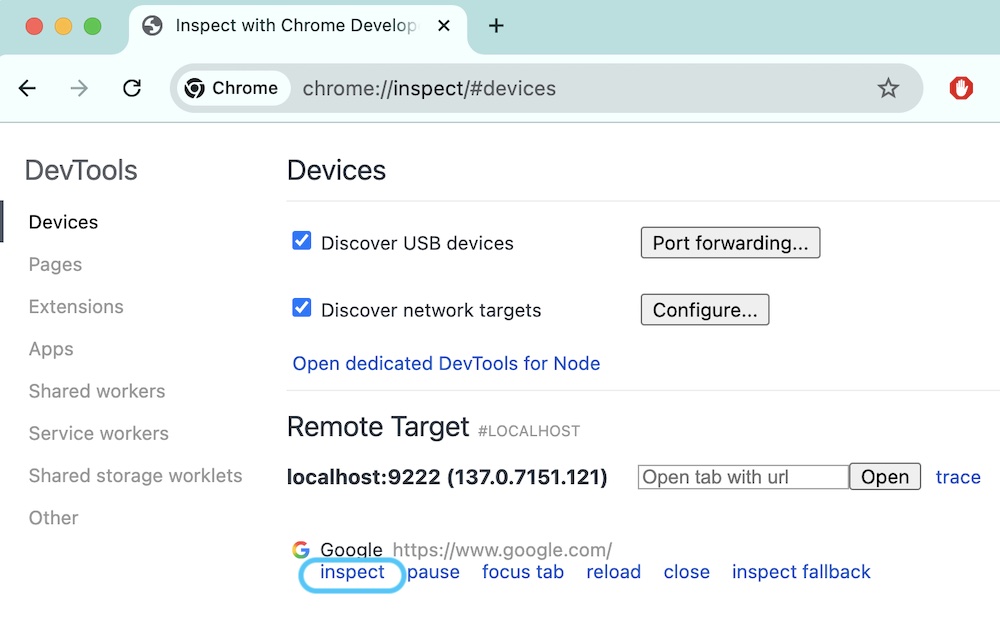 Note: If your app configures a custom port number via StandaloneWebView.EnableRemoteDebugging(portNumber), then you'll need to click the "Configure..." button next to "Discover network targets" and add the host
 localhost:{portNumber}, where portNumber is the custom port your app specified. If your app doesn't use StandaloneWebView.EnableRemoteDebugging() to specify a custom port number, then no additional configuration is needed, because chrome://inspect already listens to the default port (localhost:9222).Click the inspect link next to the webview that you wish to inspect. This will open a new Chrome DevTools window for inspecting that webview.

iOS, visionOS, and macOS WebKit
This section applies to the following 3D WebView plugins, which are powered by WebKit's WKWebView component:
- 3D WebView for iOS
- 3D WebView for visionOS
- The macOS WebKit plugin of 3D WebView for Windows and macOS
For these plugins, you can inspect web content with the Safari Web Inspector using the following steps:
First, enable remote debugging for your application as described in the section at the top of this article.
If your app is running on a physical iOS or visionOS device (i.e. not on macOS or in a simulator), then you must enable the Safari Web Inspector on the device by opening the device's Settings app, navigating to Settings > Safari > Advanced, and toggling the Web Inspector option on. For more details, see Apple's documentation for iOS and visionOS.

- Next, you must enable developer tools in Safari on your Mac. Launch Safari on your Mac and navigate to Safari > Preferences in the menu bar. In the preferences pane that appears, click on the Advanced tab and then enable the Show Develop menu option at the bottom. After you do that, you can close the preferences pane.

Next, run your application. If your app is running on a physical iOS or visionOS device, make sure that your device is connected to your Mac.
In Safari on your Mac, click on Develop in the menu bar and hover over the dropdown option that is your device's name to show a list of webview instances running on your device.

- Click the dropdown option for the webview that you wish to inspect. This will open a new Safari Web Inspector window for inspecting that webview.

Android (System WebView)
With 3D WebView for Android, you can inspect web content with Chrome DevTools using the following steps.
First, enable remote debugging for your application as described in the section at the top of this article.
Enable USB debugging on your Android device. If you use the device for development, then you've probably already done this.
Install Chrome on your dev computer if you haven't already.
Connect your Android device to your dev computer and run your application.
While your application is running with remote debugging enabled, launch Chrome on your dev computer and navigate to the URL
chrome://inspect. This page shows you a list of inspectable webviews running on your connected Android device.

- Click the inspect link next to the webview that you wish to inspect. This will open a new Chrome DevTools window for inspecting that webview.

Android with Gecko Engine
With 3D WebView for Android with Gecko Engine, you can inspect web content with FireFox DevTools using the following steps:
First, enable remote debugging for your application as described in the section at the top of this article.
Enable USB debugging on your Android device. If you use the device for development, then you've probably already done this.
Install FireFox on your dev computer if you haven't already.
Note: If your project is using 3D WebView v4.9 or newer, you can use the latest version of FireFox. But if your project is using 3D WebView v4.8 or older, then FireFox 98 must be used for remote debugging because FireFox doesn't maintain backwards compatibility with debugging older versions of Gecko. This article describes how to check the version of 3D WebView in your project. You can download FireFox 98 from the Mozilla FTP and then decline requests to enable automatic upgrades.
Connect your Android device to your dev computer and run your application.
While your application is running with remote debugging enabled, launch FireFox on your dev computer and navigate to the URL
about:debugging. This page shows you a list of connectable devices.

- Click the Connect button next to your device, and then click the device name a second time to display a list of inspectable webviews.

- Click the Inspect button next to the webview that you wish to inspect. This will open a new FireFox DevTools tab for inspecting that webview.

UWP / Hololens
First, if you're experiencing an issue where the page isn't rendering or working correctly, please see this article. For debugging web content on UWP, there are two options:
Debugging with legacy Edge browser
This first option is recommended because it is generally the easier than remote debugging on UWP. 3D WebView for UWP / Hololens is powered by the UWP WebView component, which internally uses the the EdgeHTML browser engine (v18). EdgeHTML is the browser engine that was previously used by Edge browser until it switched to Chromium in 2020. So, the easiest way to debug web content is to load the web page in an instance of the legacy Edge browser (v18) and use the browser's dev tools to inspect the page. Note: new versions of the Edge browser app (including on Hololens) use Chromium instead of EdgeHTML, so they don't exhibit the same quirks as legacy Edge (v18). To make it easy for people to test web content in the legacy Edge browser, Microsoft has partnered with BrowserStack to provide free access to use legacy Edge:
Go to BrowserStack and click the "Get started free" button.
Create a new BrowserStack account or sign in with an existing account.
To launch the legacy Edge browser, select Windows 10 in the left pane and then click version 18 of Edge. Note: the BrowserStack UI may say "Each device is available for up to 1 minute during Free Trial", but this is incorrect; thanks to the Microsoft partnership, there is no time limit for Edge.

After BrowserStack launches the legacy Edge browser instance, you can load your URL in the browser to check if it renders correctly.
Once your web page has loaded, right-click on the page and select "Inspect element" to debug the page with the browser's dev tools. This will allow you to view the JavaScript console to check for errors, which can occur if the page uses JavaScript features not supported by EdgeHTML.
Remote debugging on UWP
Another option for 3D WebView for UWP / Hololens is to inspect web content with Visual Studio 2017 using the approach outlined in this MSDN article. Here's a summary of how to enable it:
- Right-click on your project in the Solution Explorer and then click "Properties" at the bottom of the context menu
- In the left pane of the properties view, click "Debugging"
- Set "Debugger Type" to "Script Only"

Now when your application is running in the debugger, you can open the JavaScript console via Debug->Windows->JavaScript Console or view the DOM Explorer via Debug->Windows->DOM Explorer. However, there are a couple of caveats to this approach:
- Microsoft removed the JavaScript console in Visual Studio 2019, so Visual Studio 2017 is needed in order to use it
- This approach works well when the application is running on the local machine, but I haven't successfully gotten it to work when the application is running on a remote device, like Hololens
WebGL
With 2D WebView for WebGL, you can inspect web content using the developer tools of the browser in which the Unity app is running. Here are links to instructions on how to access the developer tools of popular browsers: